I've been logging for over a year now on things like spam registration attempts and spam posts that I've blocked. I decided to take the logs and put them into a graph, to see any trends.
Side note: All images are thumbnails, click for larger
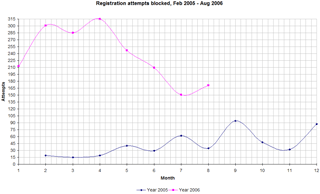
First, spam registrations:

As you can see, it has rocketed. Spam registrations in April 2006 peaked at 315. August 2006 isn't yet over (data runs up to the 15th), but that is already at 171 attempts.
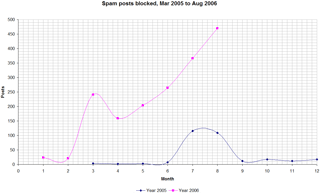
Secondly, spam posts:

Well. I think the graph speaks for itself. This month's data is up til the 18th, and it is at 470 already.
If anyone knows how to get Excel to actually put month names, do post here, It's been annoying me all day!

